
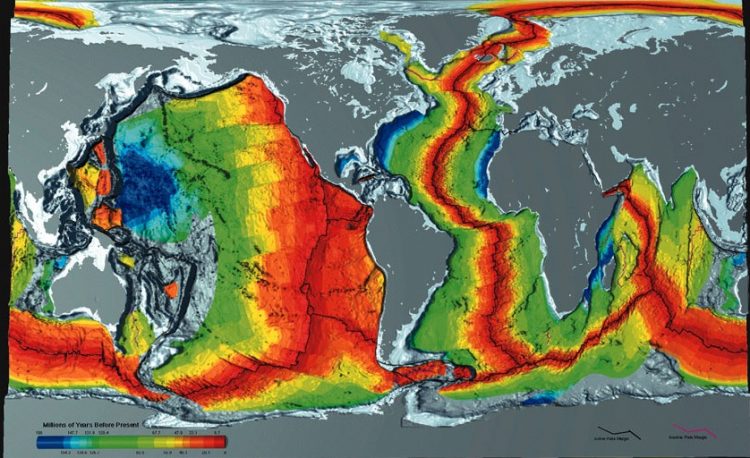
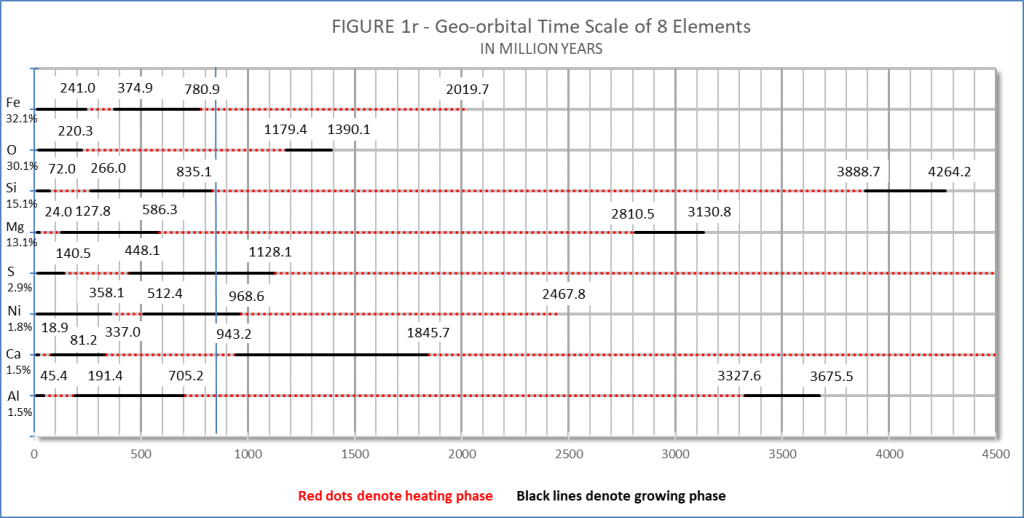
The Ionic Growing Earth (IGE) posits the same 8-elements that started the Earth, heated the planet for the first 3 – 3.5 billion years of its existence (see IGE Fig. 1r below). The arrival of water ~ 1400 mya solidified the molten crust and by ~1200 mya submerged the smaller planet. (~700-800 km radius). Dating the oldest land plants and spores indicates land emerged above water ~470 mya (~1600 km radius). At those times, the magma located directly under the solid (predominately continental) crust was formed (to some degree) in layers corresponding to the color images on the NOAA Age of the Ocean Floor (rainbow map) as follows:
1. White Over 180 mya
2. Purple 155 – 180 mya
3. Blue 140 – 155 mya
4. Green 55 – 140 mya
5. Yellow 40 – 55 mya
6. Orange 20 – 40 mya
7. Red 0 – 20 mya
8. undesignated ? future
Color layering is sequential; not chronicle
The first magma layer, white on the rainbow map, designating the continental shelves, edges of some continents, and large areas around the North Pole was under a unified crust. When expansion cracks developed, this first layer erupted through and solidified upon cooling. Thus, in any given area, the white shelf matter was the first to rise and fill cracks as they opened.
Starting ~180 mya, (The Opening of Pangaea?) as expansion continued in a specific area to exhaust the white layer, the second layer (purple) became available to fill the expansion cracks. This means the cracks separating North America from North Africa or South America from South Africa (The Opening of the Atlantic Ocean?) or Madagascar from Africa (The Opening of the Indian Ocean?) are not time of occurrence reliable as the rainbow map implies. This same time presumption is misleading when applied to successive layering of the oceanic crust. The oceans were not opening at the same time or expanding at the same rates indicated on the color-time chart. The Opening of the North Pacific began with Zealandea breaking away from Australia and separating together from Alaska and Canada. We don’t know when the Pacific, Atlantic, Indian, or Arctic Oceans opened or when each of the magma layers transitioned to crust in different parts of the globe. One can presume the white spots on various continents are from the first magma layer beneath the continent but not the time of such occurrences.
The rainbow map indicates the Gulf of Mexico was fully opened ~155 mya which is not necessarily true. The map would also indicate the purple blob on the Philippine Plate (above Australia) began ~180 mya and remained in situ. The color layering on the map is sequential, but not globally chronological.
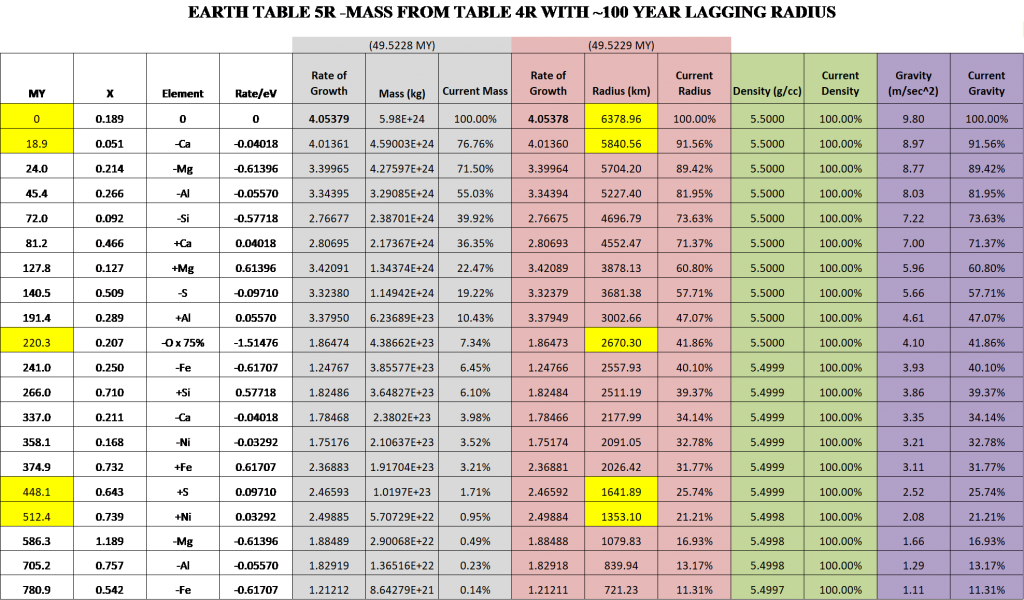
Pretending to know what is unknown is bad science. Pretending Earth is not growing/expanding along with every other celestial body in an expanding universe is fake science. The magma located under the solid crust is lifting the continents and the ocean floor(s). The cracks created by the uplifting, fill with pressurized lava that cools and solidifies as new crust. IGE Table 5R (below) indicates the entire surface of the planet is rising outwardly at the present (accelerating) rate of 2.85 cm each year [(6378.96 km – 5840.56 km)/ 18.9 my]. Over a longer period of ~220 my (when the accelerating began) the average rate is 1.68 cm/ yr [(6378.96 km – 2670.30 km)/ 220.3 my]. Similar rates by Jan Koziar and James Maxlow are within range.
The resulting growth rate of Earth’s outer shell is very interesting when applied to the time when (assuming) the planet was submerged under water ~500 mya. The same Table 5R indicates a radius of 1353.10 km at 512.4 mya and a radius of 1641.89 km at 448.10 mya. Hence, the outer shell elevates 0.449 cm/yr [(1641.89 – 1353.1) / (512.4 – 448.1)] or nearly 1/2 meter per century. Since water (oxygen) was not growing between 1200 mya and 220 mya, the water level dropped significantly over millions of years to expose the land that vertebrate animals from the “seas” invaded ~370 mya. This confirms why all prior animal life was…“born of the seas”; a sea entirely covering and slowly cooling the planet.
The rainbow map raises more questions than it answers. While the design of the map supports the expansion part of Plate Tectonics; it does not support the subduction and recycling parts without wild assumptions. A better geological chronology may be obtained when the origin of the heat and pressures within the planet (the cause) becomes known.
![]()